2-8. Style with a colormap
Now that your COG is attached, style it with a colormap so the pixel values render as a colour ramp on the map.
- Select the pencil edit icon at the top of your Above Ground Biomass layer card to return to edit mode.
- Expand the Data Visualisation section (the eye icon) on the layer card.
- Next to Colormap, select the pencil icon (or the Add… affordance if no colormap is set yet). The colormap editor opens.
- Pick a colour ramp of your choice — for example Viridis for biomass.
- Enter the min and max values you noted from the COG metadata in the previous step. Values outside this range are clamped.
- Save the colormap, then Save changes on the layer card.
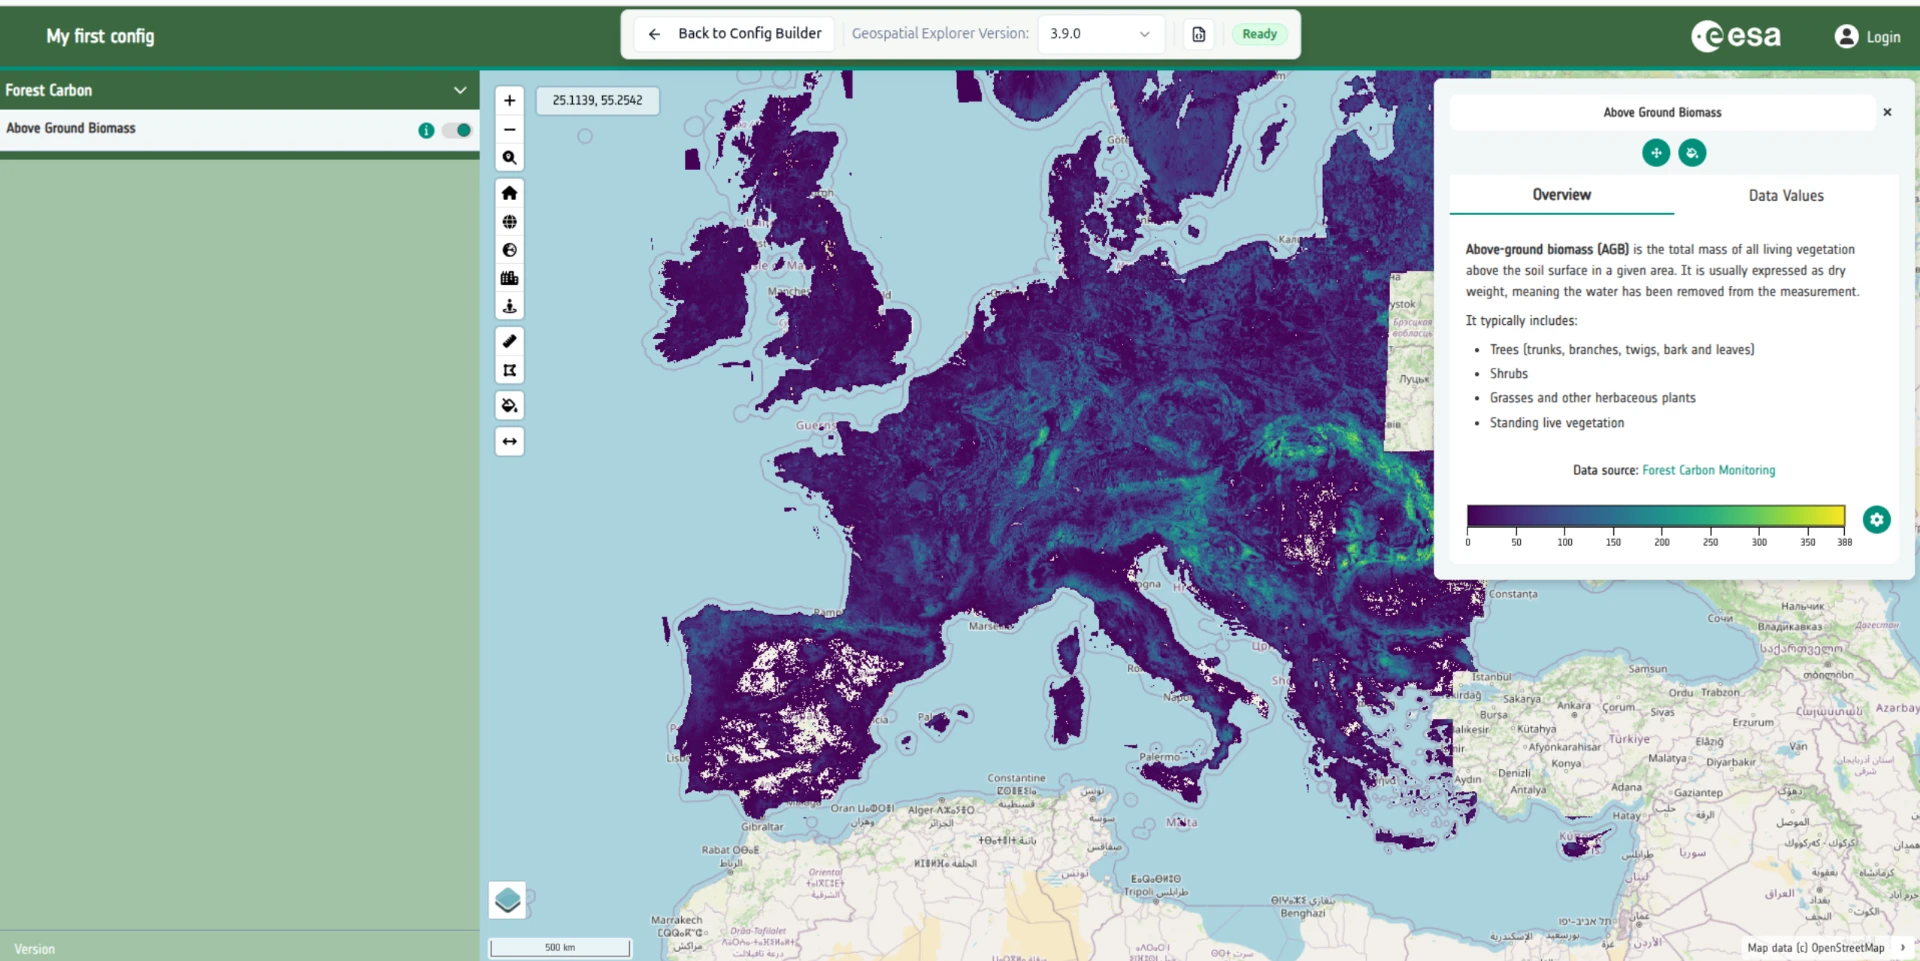
- Go to GE Preview. The AGB data now renders with your colour ramp, and the legend is generated automatically from the colormap. Your map should look something like this:
One styling tool at a time
Categories, Colormap, RGB Composite and Gradient are mutually exclusive for a raster layer — activating one clears the others.
See Colormaps for the full colormap reference.