9. Multi-spectral data
Tutorial Objectives
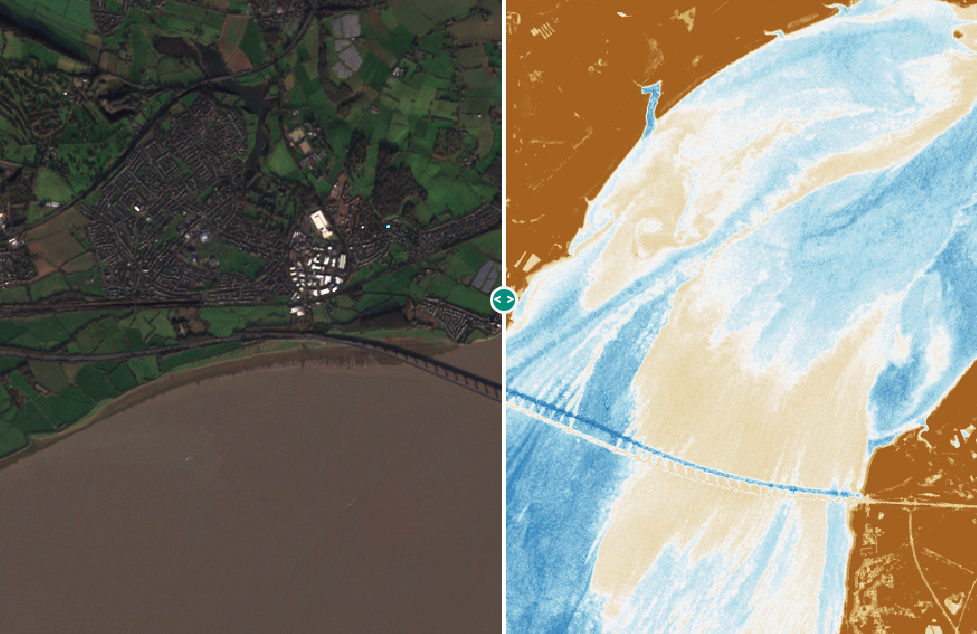
In this tutorial you will understand how the Geospatial Explorer handles multi-spectral data and learn to build a configuration that can:
- Display multi-spectral data as colour composites
- Visualise indices related to vegetation, water or other factors
- Create time series using multi-spectral data
- Show spectral signature or time series charts
- Use swipe layers to compare data of different visualisations or dates