10-6. Customising vector field values
When someone clicks a vector feature in the Geospatial Explorer, the Data Values panel lists that feature's properties. Unless you tell the Explorer otherwise, it shows the data exactly as it is stored. In this exercise you will turn the raw properties of the Oslo nitrogen dioxide data into a short, readable summary.
Look at the raw values first
-
Open Preview, turn on Oslo Downscaled Surface NO2 and zoom to Oslo.
-
Open Data Values and click one of the grid cells.
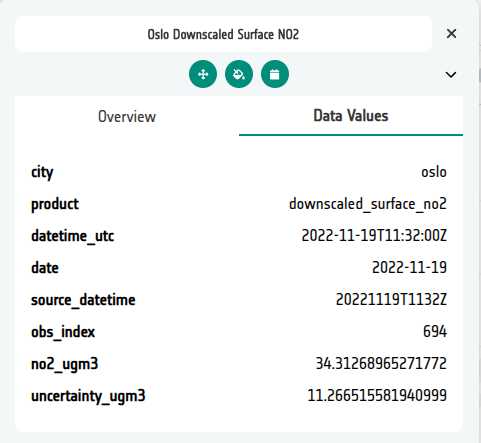
Notice that:
- the labels are raw property names such as
no2_ugm3anduncertainty_ugm3; - numbers are shown at full precision, with no units;
- housekeeping fields such as
city,product,datetime_utc,source_datetimeandobs_indexare listed even though they don't help the reader.
Customise the fields
-
Return to the configuration and open the Oslo Downscaled Surface NO2 layer card. Open the Manage Fields editor.
-
Select Populate field details. The editor reads the property names from the layer's data and adds one row per field. The layer contains many dated GeoJSON files, but they all share the same fields, so the settings you make here apply to every date.
-
Enter a Display label for the three fields readers need:
Field name Display label dateObservation dateno2_ugm3Nitrogen Dioxideuncertainty_ugm3Uncertainty -
For both
no2_ugm3anduncertainty_ugm3, set the Suffix toug / m3and the Precision to2. Values such as17.382913will now be shown as17.38 ug / m3. -
Turn on Hide for
city,product,datetime_utc,source_datetimeandobs_index.Hidden fields are kept
Hidden rows stay in the editor, greyed out. In the configuration they are stored as
null, so you can unhide them later without losing anything. -
Use the up/down arrows or the drag handle to put the visible rows in this order: Observation date, Nitrogen Dioxide, Uncertainty. This order is the order in which the fields appear in the Data Values panel.
-
Select Save.
Check the result
-
Open Preview again, turn on the Oslo layer if needed and click the same cell. The Data Values panel now shows three clearly labelled values with units and two decimal places. The housekeeping fields are no longer listed.
-
Optionally, open the JSON editor and find the Oslo layer's
meta.fields. It should be equivalent to:"fields": { "date": { "label": "Observation date" }, "no2_ugm3": { "label": "Nitrogen Dioxide", "suffix": "ug / m3", "precision": 2 }, "uncertainty_ugm3": { "label": "Uncertainty", "suffix": "ug / m3", "precision": 2 }, "city": null, "product": null, "datetime_utc": null, "source_datetime": null, "obs_index": null }Your file may also include an
ordervalue on each visible field. This records the row order you set in step 8.
For the full list of field options, including date formatting and URL fields, see Data Values (vector).