10-5. Graduated styling
Graduated styling divides numeric values into classes and colours them along a ramp. This makes lower and higher values easy to compare without requiring a separate colour for every exact measurement.
-
Open the Oslo Downscaled Surface NO2 layer card. Under Data Visualisation, select the Pen next to Vector Styling.
-
In the recipe gallery, select Graduated.
-
Keep Symbolise as set to Polygons — fill + outline and select the
no2_ugm3field. This is the estimated nitrogen dioxide concentration in micrograms per cubic metre. -
Keep the detected range and Equal interval classes. Choose a sequential colour ramp in which the progression from low to high values is clear, then select Create rule and Save.
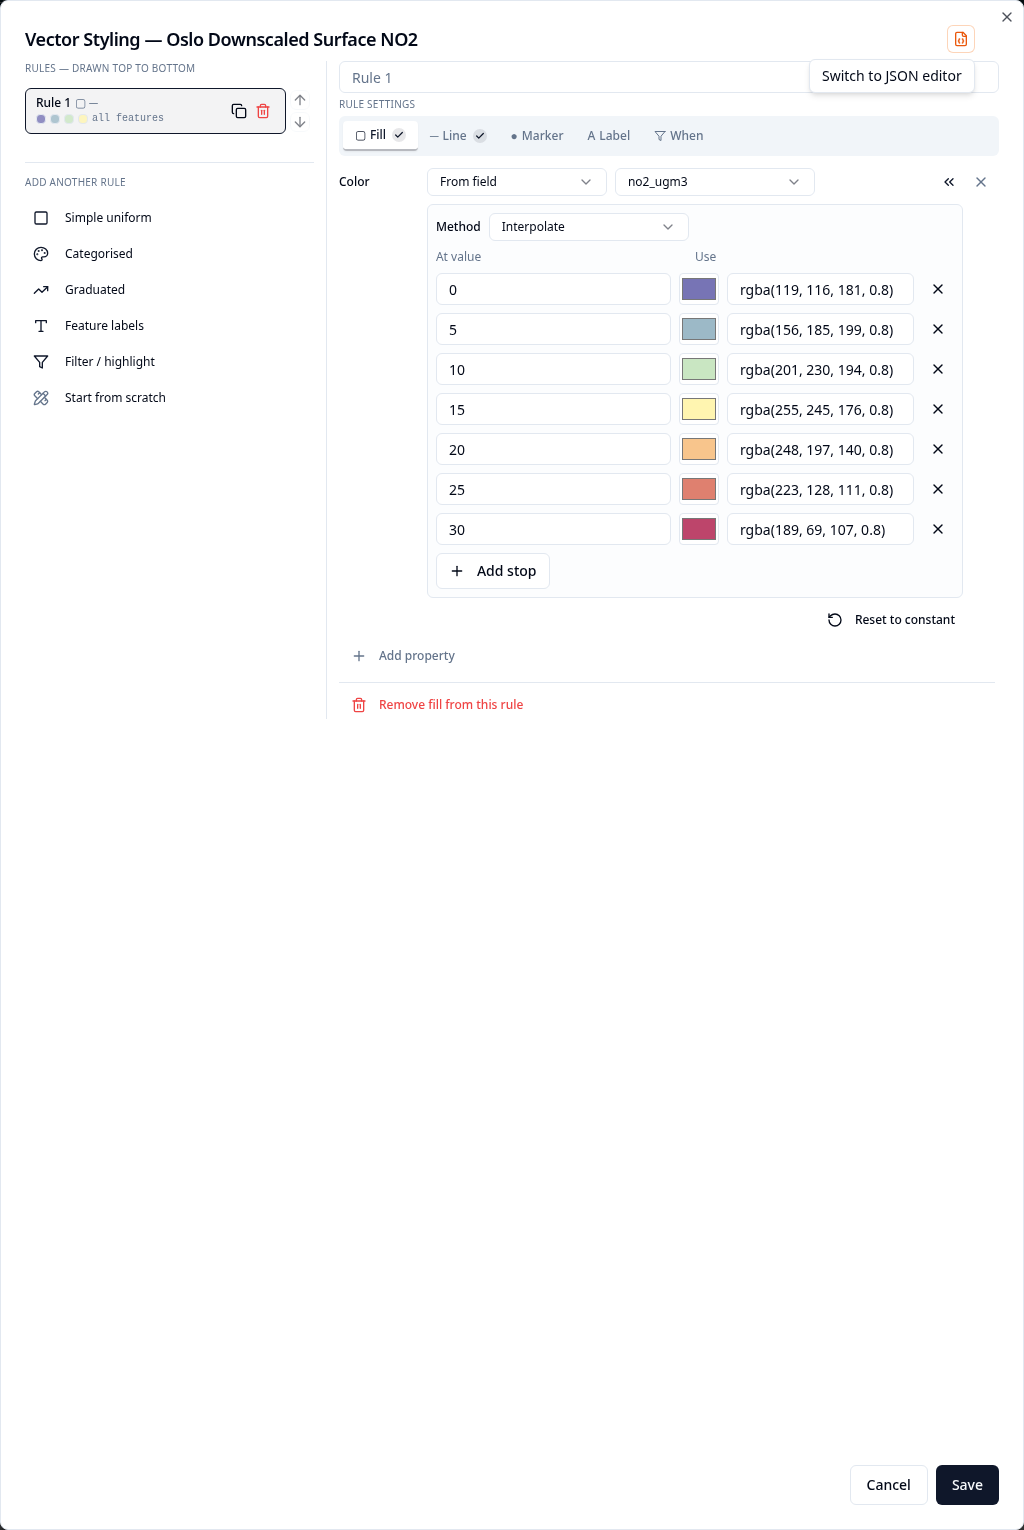
- Open Preview, turn on Oslo Downscaled Surface NO2 and zoom to Oslo. Compare areas with lower and higher concentrations. Use the temporal control to move between dates and see how the pattern changes.
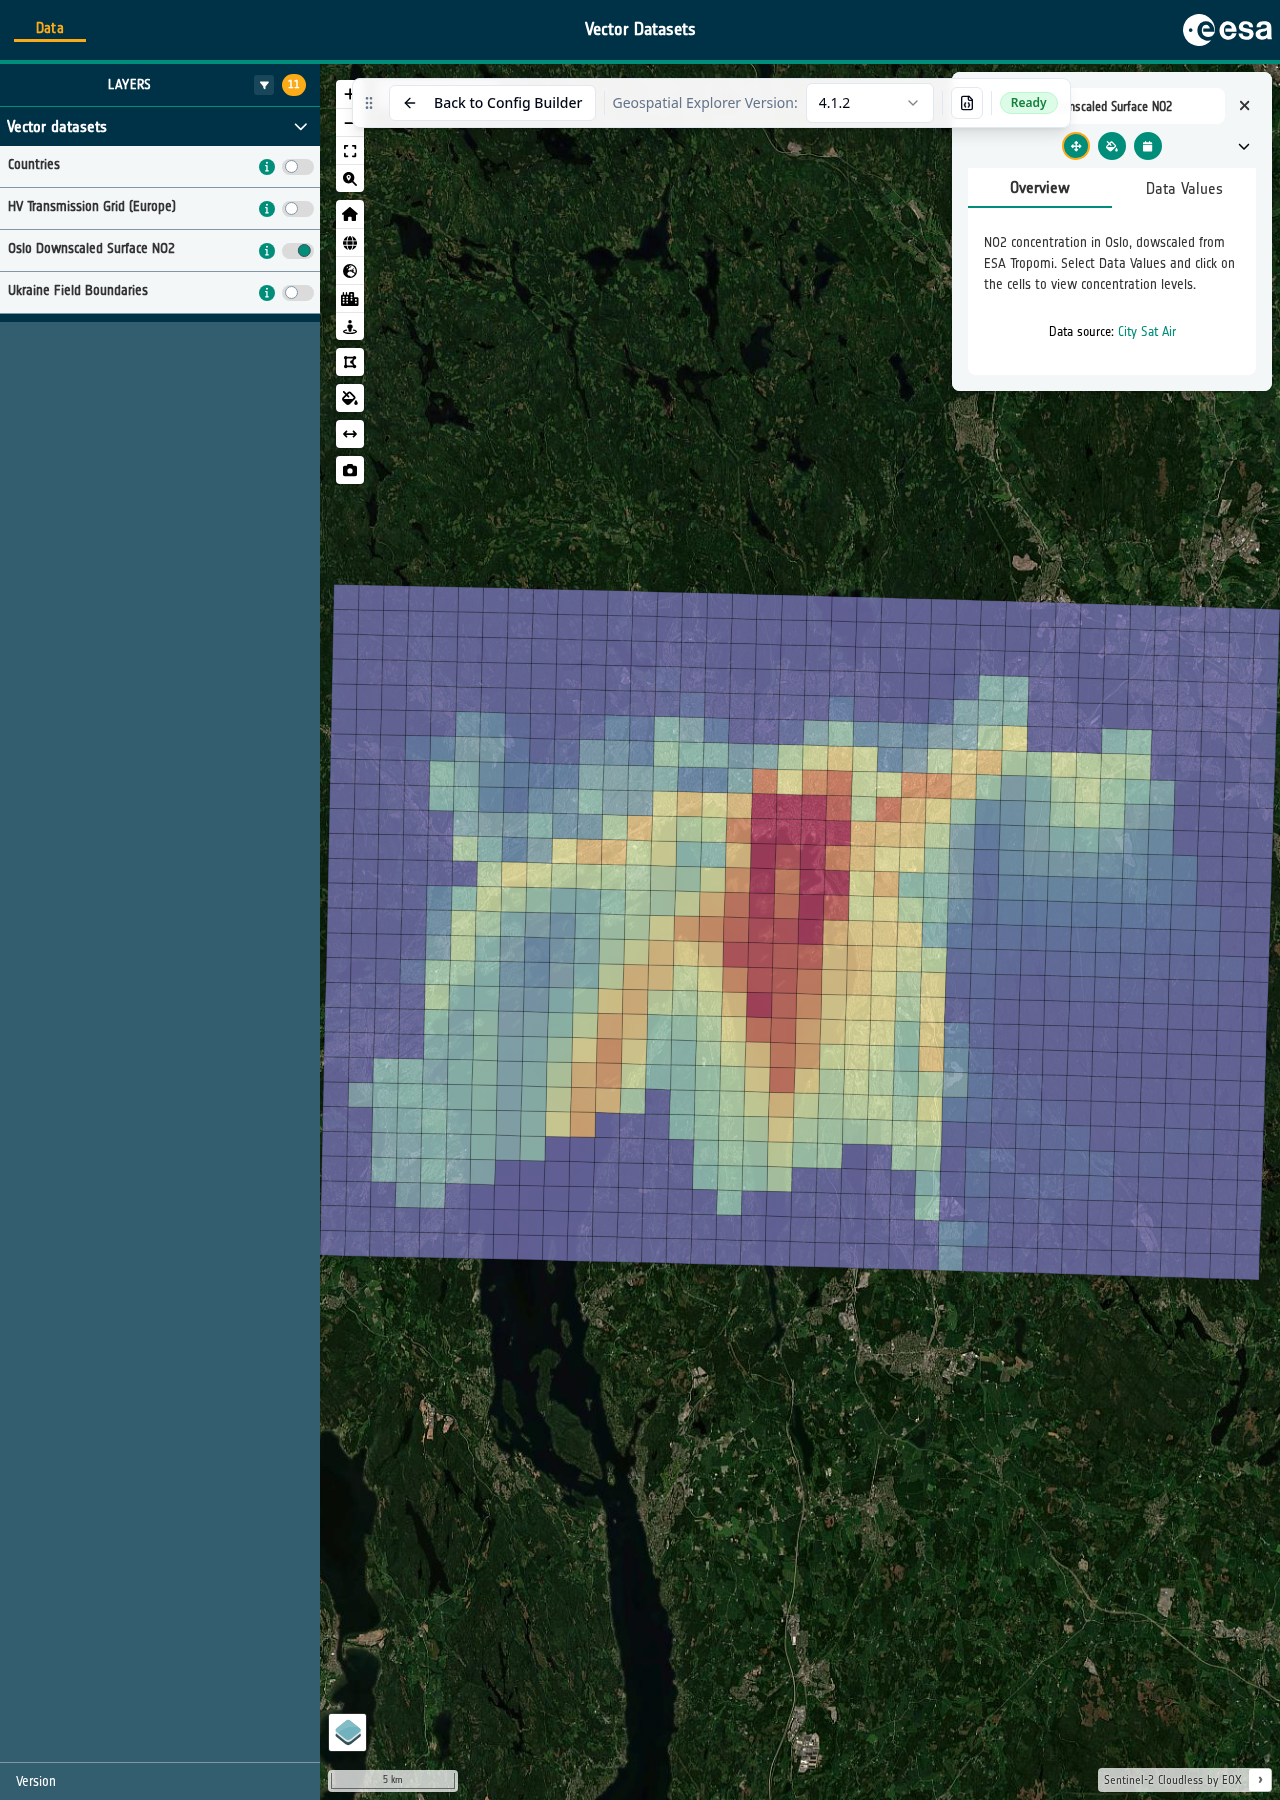
The layer contains many dated GeoJSON datasets. The vector style is applied to all of them, so the same colours and class boundaries remain meaningful while you move through the time series.