10-4. Categorised styling
Categorised styling assigns a colour to each distinct value of an attribute. It works best when the attribute has a manageable number of repeated values.
-
Open the HV Transmission Grid (Europe) layer card. Under Data Visualisation, select the Pen next to Vector Styling.
-
In the recipe gallery, select Categorised.
-
The grid is line data, so check that Symbolise as is Lines — stroke. Select the
voltagefield. The recipe reads the source data and lists the detected voltage values as categories. -
Choose a palette. You can select Reverse if you prefer its colours in the opposite order, then select Create rule and Save.
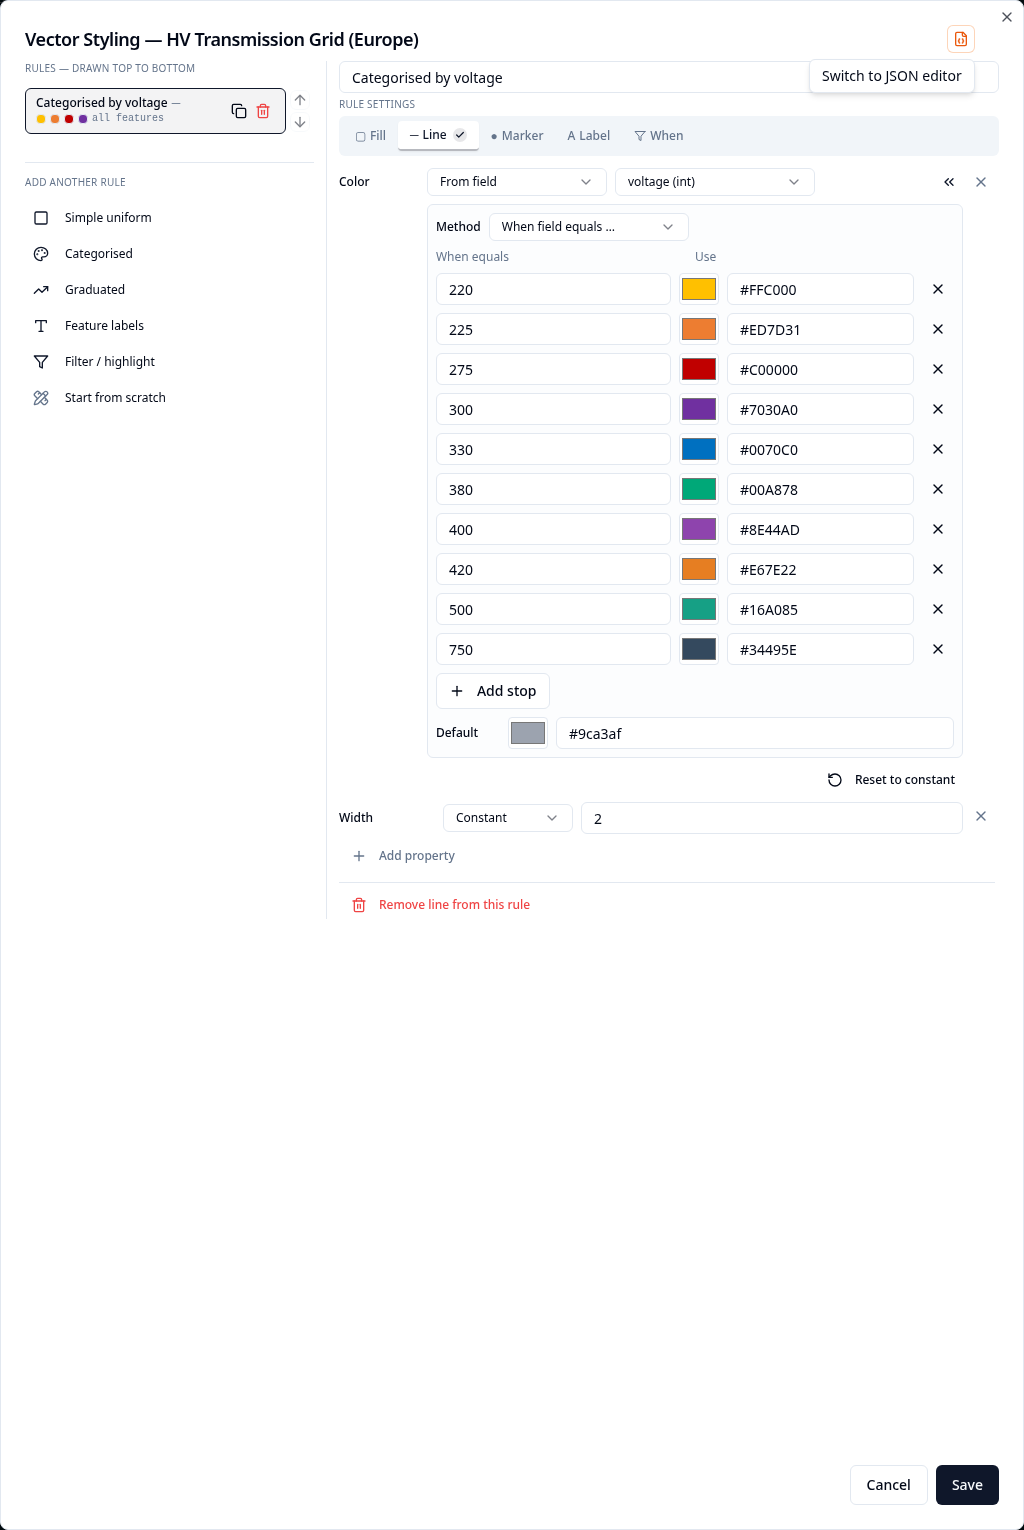
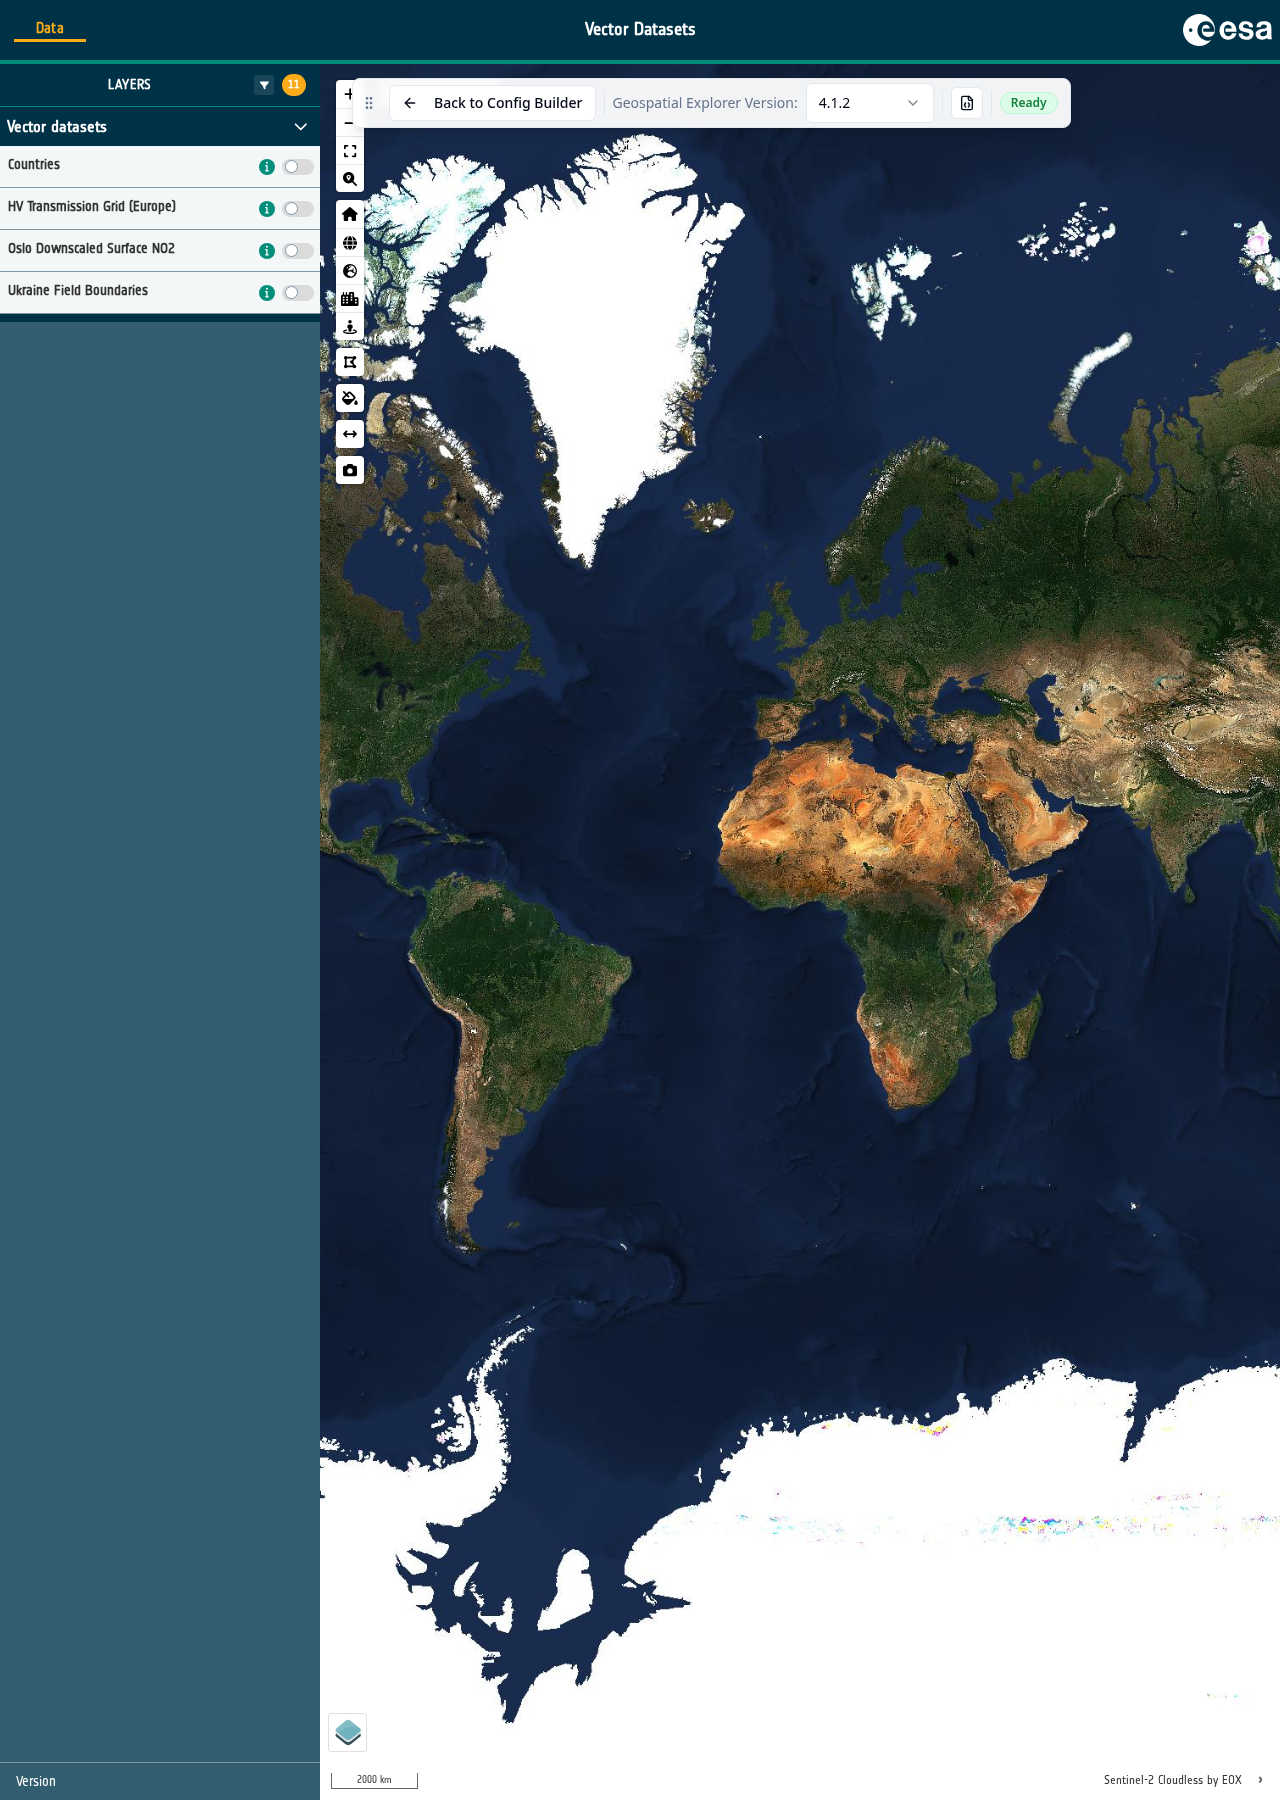
- Open Preview, turn on HV Transmission Grid (Europe) and zoom into an area of the network. The line colours now distinguish the voltage values.
Note
voltage is stored as a number, but here we are treating each detected
voltage as a distinct category. The next exercise uses numeric values as a
continuous range instead.