8-7. Histogram statistics
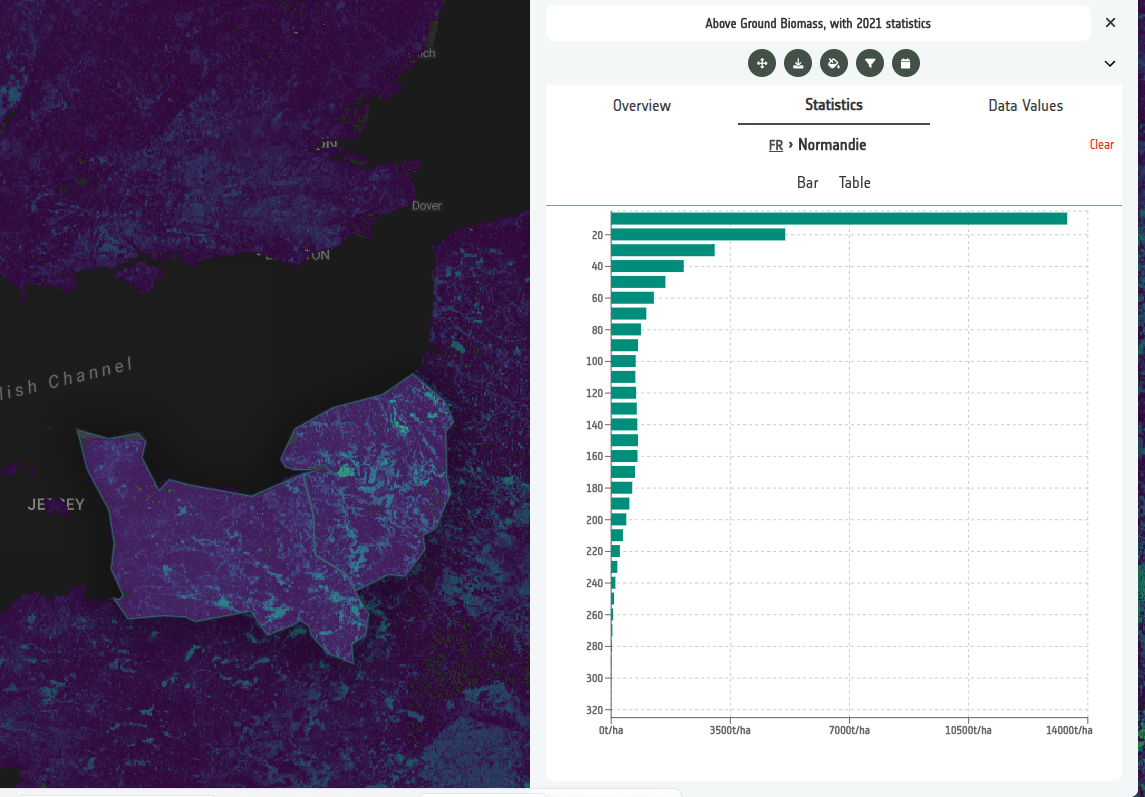
In exercises 8-4 and 8-5, we added in statistics that had been created for categorical data. However, the same structure of statistics file can also be used to present histograms. In this exercise, we also add statistics files in bulk.
- Navigate to the
Above Ground Biomasslayer that you created in exercise 2. Select +Add statistics from the statistics tab.
- This time, select the From service option and pick the Sparkgeo ESA Apex S3 bucket option.
- Navigate to APEX Example data -> NUTS
- Type 2021_AGB into the search box
- Click +Add all
The configuration builder is clever enough to parse the file names for level01, level02 etc, and set the appropriate statistics layers.
-
Now go to Preview. From the statistics panel you can now navigate through the histogram charts.
-
Optional: Add the level 00 statistics as a data source to a Temp 2 layer, as you did in the last exercise, and inspect its data values.