8-6. Understanding the statistics files
The statistics you just saw are not calculated by the Explorer. They are read straight from the attributes of the NUTS features. To see that for yourself, load one of the same files as ordinary vector data.
-
Add a new layer and name it
Temp. -
On the
Templayer card, open Data Sources and stay on the Data tab — not Statistics this time. -
Click Add source, choose Direct connection and the format FlatGeoBuf.
-
Use the NUTS level 0 file again:
https://esa-apex.s3.eu-west-1.amazonaws.com/APEX-example-data/HI-RES-NUTS/stats.esa_worldcover_2021.nuts_2024.epsg4326.level00.fgb -
Save the source and open the Preview, turning the
Templayer on. The country boundaries are drawn as a normal vector layer. -
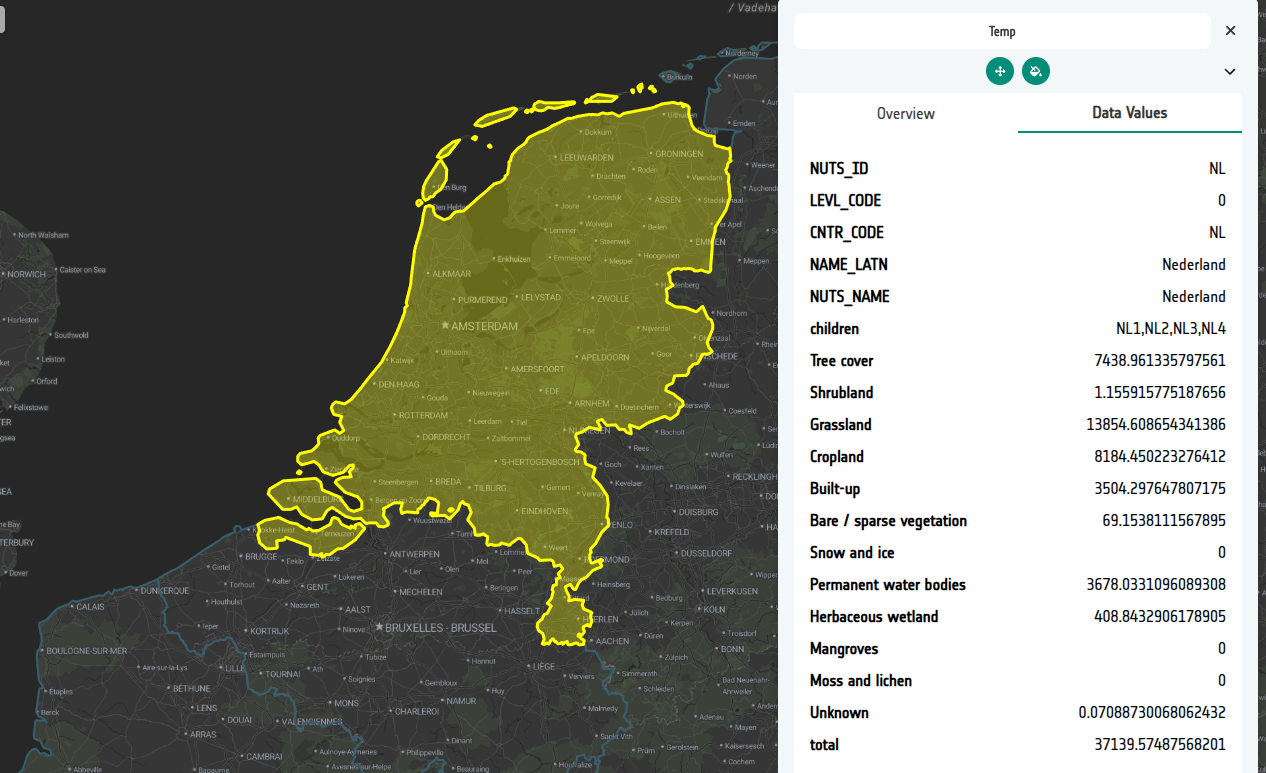
Select the Data Values tab in the panel and click on a country. The feature's properties are listed in full.
-
Look at what is there. Alongside the descriptive fields — country and region names, NUTS codes, level — are the pre-computed class areas for each World Cover class. These attributes are exactly what the Statistics tab reads and charts under the bonnet; the only difference is that a statistics source is interpreted as a summary to plot, rather than as a layer to draw.
-
Delete the
Templayer when you are done — it was only there to look inside the file.
Building your own statistics files
Any FlatGeoBuf or GeoJSON of zones will work as a statistics source, as long as each feature carries the pre-computed values as properties and the file is published in a CRS the Explorer can reproject.