6-6. Using WMS / WMTS time parameters
Some services expose time through a TIME parameter on a single layer, rather
than as separate layers. In that case the Geospatial Explorer can drive the
temporal control directly from the service.
- Create a new interface group called Soils, and inside it a layer card called Soil Water Index Daily Time Series.
- In the layer Controls, add Temporal Control → Days.
- Select + Add dataset → Direct Connection → Add WMTS. Note that this is WMTS, not WMS.
-
Enter the source URL:
https://land.copernicus.eu/cdse/swi_europe_1km_daily_v2/ -
Enter the layer name:
SWI010 -
Note that the Use TIME parameter toggle is enabled — the builder has detected that the service advertises a time dimension for this layer.
-
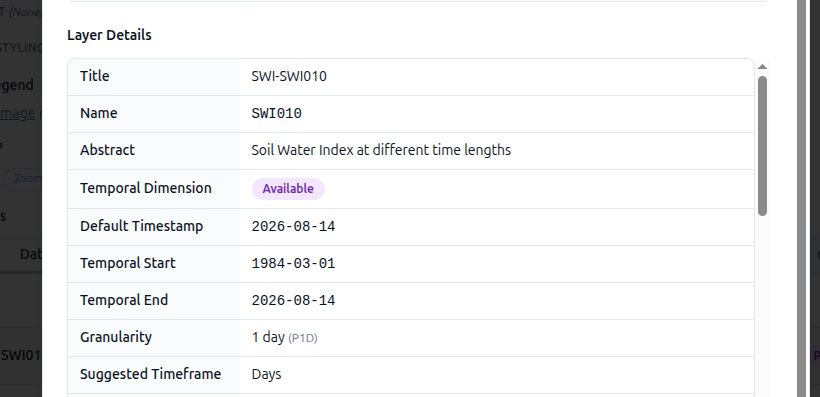
After adding the dataset, click the (i) icon on the dataset row to open the metadata. This shows the temporal extent and the granularity advertised by the service.
-
Open Units and Legend, set Legend type to Image and paste in:
https://land.copernicus.eu/en/cdse-legends/clms_global_swi_12-5km_v3_10daily.png/@@images/image-89-5435993c0267e2917be79312734cfade.png -
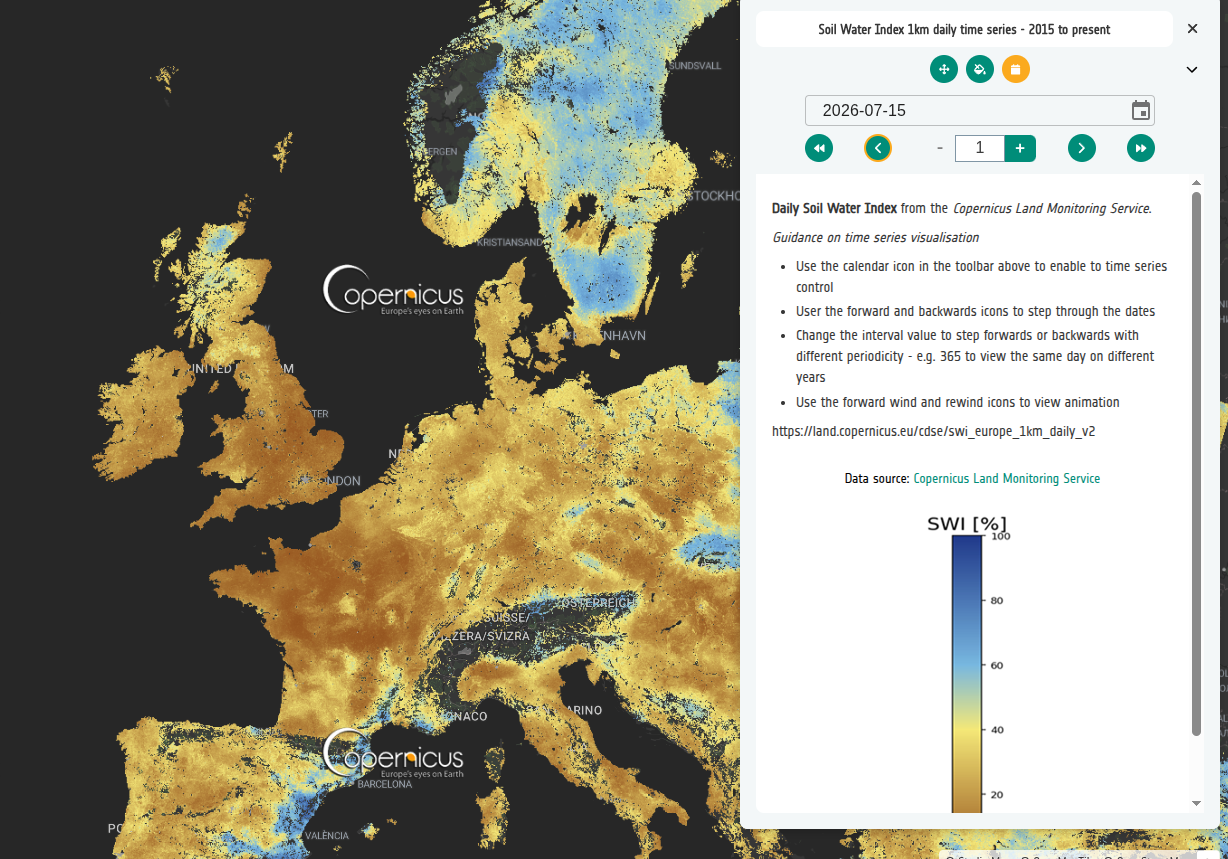
Save and click Preview. The layer has a daily temporal control, and the official CLMS legend graphic is shown alongside it.
Tip
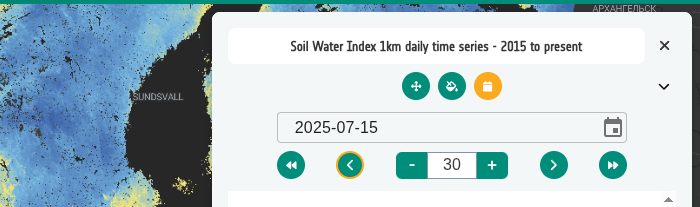
To see how the soil changes month on month throughout the year, increase the Increment steps value to 30. The time series will then jump forward 30 days at a time, making it easier to compare monthly conditions.
Did you remember to export?
If not, now is a good moment.