Statistics
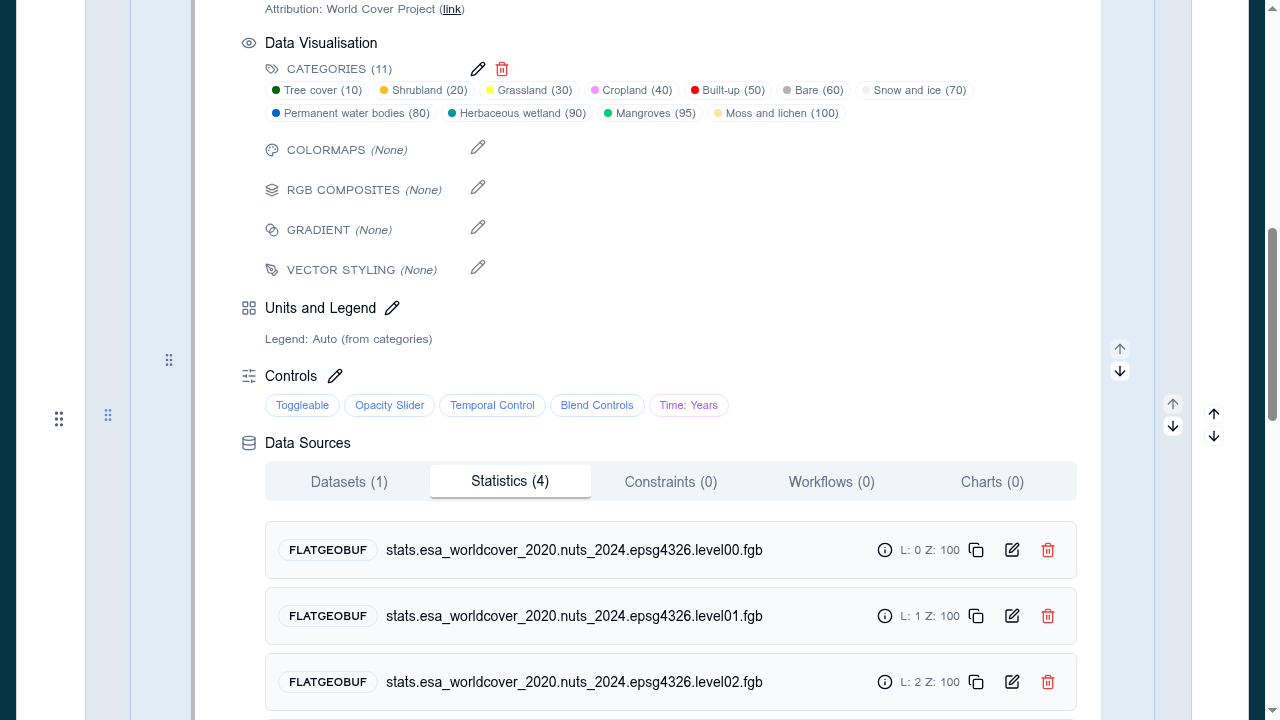
The Statistics section of a layer card configures vector sources holding pre-computed summary statistics for the layer — typically one file per level of administrative boundary.
Statistics sources are separate from the layer's display sources: the user sees the styled layer on the map, and the statistics files supply the clickable zones and the numbers reported for each of them.
When to use
Add Statistics sources when you want users to:
- Click a zone (country, region, catchment, grid cell) and see a numeric summary for it.
- See a class breakdown of categorical data per area.
- Get finer detail as they zoom in, without recomputing anything.
If the layer is purely visual and no numeric summary is needed, leave Statistics empty.
Configure
In the layer card, open Data Sources → Statistics and add one or more sources. Each entry uses the same DataSourceItem shape as the main data array:
- URL — link to the statistics file.
- Format —
flatgeobuf(preferred) orgeojson. Other formats are rejected. - Level —
0for the coarsest boundaries, incrementing for finer ones. The builder pre-fills the next unused level; the viewer chooses a level based on map zoom. - zIndex — usually above the display data so the zones remain clickable.
The features themselves carry the pre-computed attributes (for example the area of each land cover class within the zone). Defining categories on the layer gives those values their labels and colours.
Validation
- Each statistics source must have a
urland aformatofflatgeobuforgeojson. levelvalues should run from0upwards, with no gaps or duplicates.- Features must be in a CRS the viewer can reproject (EPSG:4326 is the usual choice) and should cover the same area as the displayed layer.
Related
- Data visualisation
- GeoJSON / FlatGeoBuf data sources
- Categories
- Tutorial 8. Statistics
- Pixel-values charts — point-sampled equivalent.