Charts overview
Charts are added per-layer from the Charts tab in the Data Sources section of the layer card. They render with Plotly and appear next to the layer in the APEx Geospatial Explorer when a user opens the info panel or selects a feature.
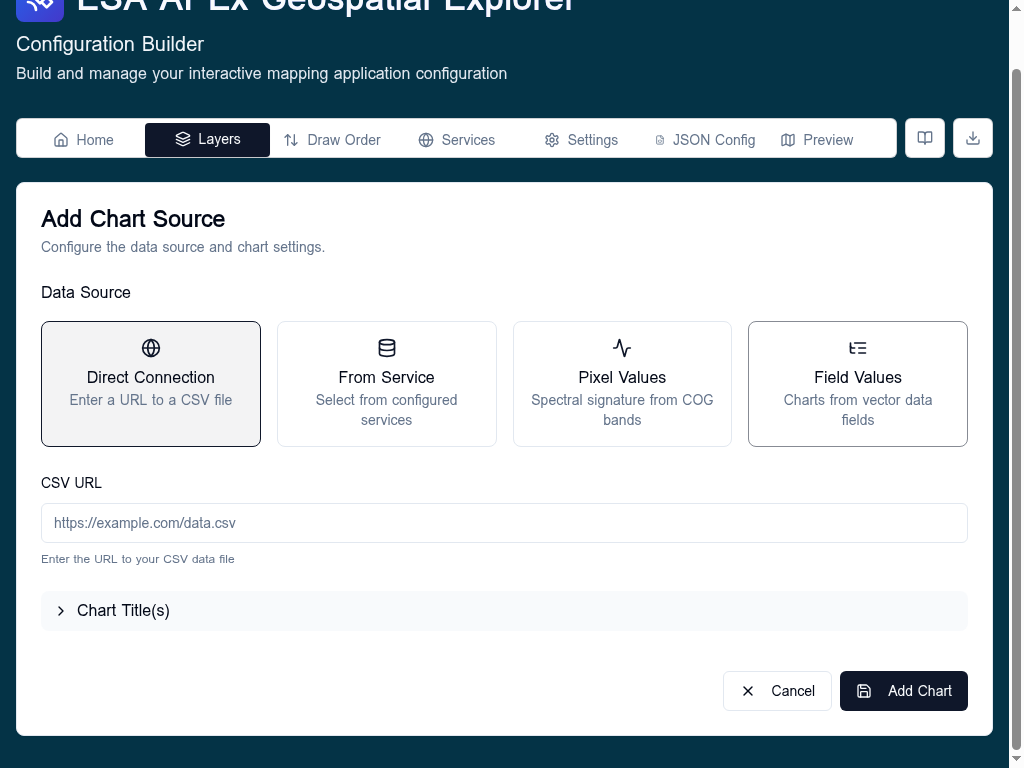
Source types
A chart pulls data from one of five sources:
| Type | Use for | Notes |
|---|---|---|
| Direct Connection | A CSV at a known URL | Simplest case; the URL is fetched at runtime. |
| From Service | A configured backend service that returns CSV/JSON | Pick a service registered in the Services tab. |
| Pixel Values | Spectral signature from a multi-band COG | Requires at least one COG data source on the layer. See Pixel values. |
| Pixel Time Series | One band's value over time from a COG time series | Requires several timestamped COGs on the layer. See Pixel time series. |
| Field Values | Counts/sums from GeoJSON or FlatGeoBuf properties | Used for inline pie charts. See Field values. |
Supported chart types
The visual editor currently supports Line, Area, and Bar for chartType: xy, plus Pie charts for the Field Values source. Histogram support exists in the schema but is not yet exposed in the editor UI.
Related
- Visual editor — building traces and styling them.
- CSV data — date detection and numeric parsing rules.