Standard layers
A standard layer is the default kind of layer card — a toggleable, styled overlay that the user picks from the layer panel. It is the right choice for almost any data overlay that is not a basemap or a swipe comparison.
Follow along
Screenshots on this page were taken with the Comprehensive demo config loaded.
What a standard layer carries
| Section | Purpose |
|---|---|
| Basic info | Title, description, interface group, optional sub-interface group. |
| Data sources | One data source plus optional statistics. RGB composites and time-series use multiple sources here. |
| Visualisation | Exactly one of: colormap, RGB composite, vector styling, or categories. See Data visualisation. |
| Legend, attribution, fields, controls | Optional but they clear Config QA flags. |
Sources expected by sub-type
| Sub-type | Sources |
|---|---|
| Standard raster or vector | One data source, optional statistics. |
| RGB composite | Three or more raster sources, one per band. |
| Time-series | One data source plus per-timestamp variants. |
Add a standard layer
Step 1 — Open the Add New Layer screen
There are two entry points:
- Layers tab → Add Layer (top of the tab) — opens the type selector with no preselected interface group.
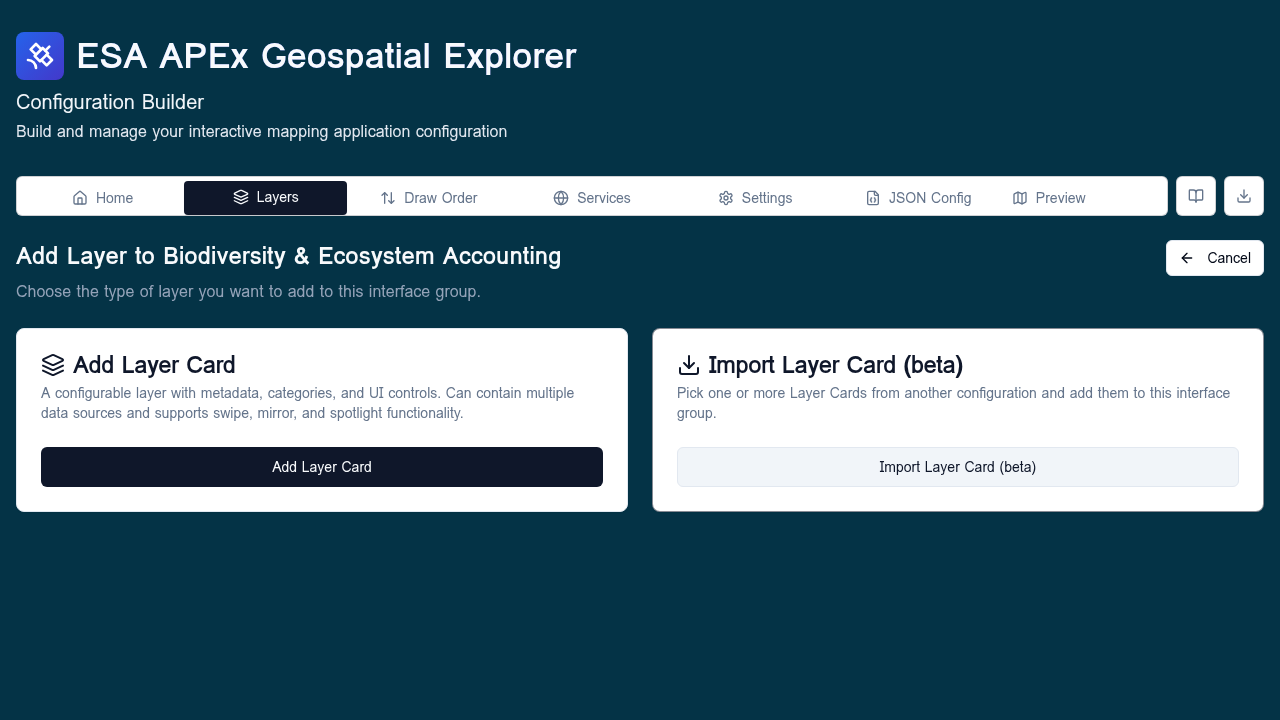
- Layers tab → "+" inside an interface group — opens the type selector with that group preselected; the screen header reads Add Layer to <group name>.
The selector shows two tiles. Pick Add Layer Card.
Step 2 — Fill in the editor
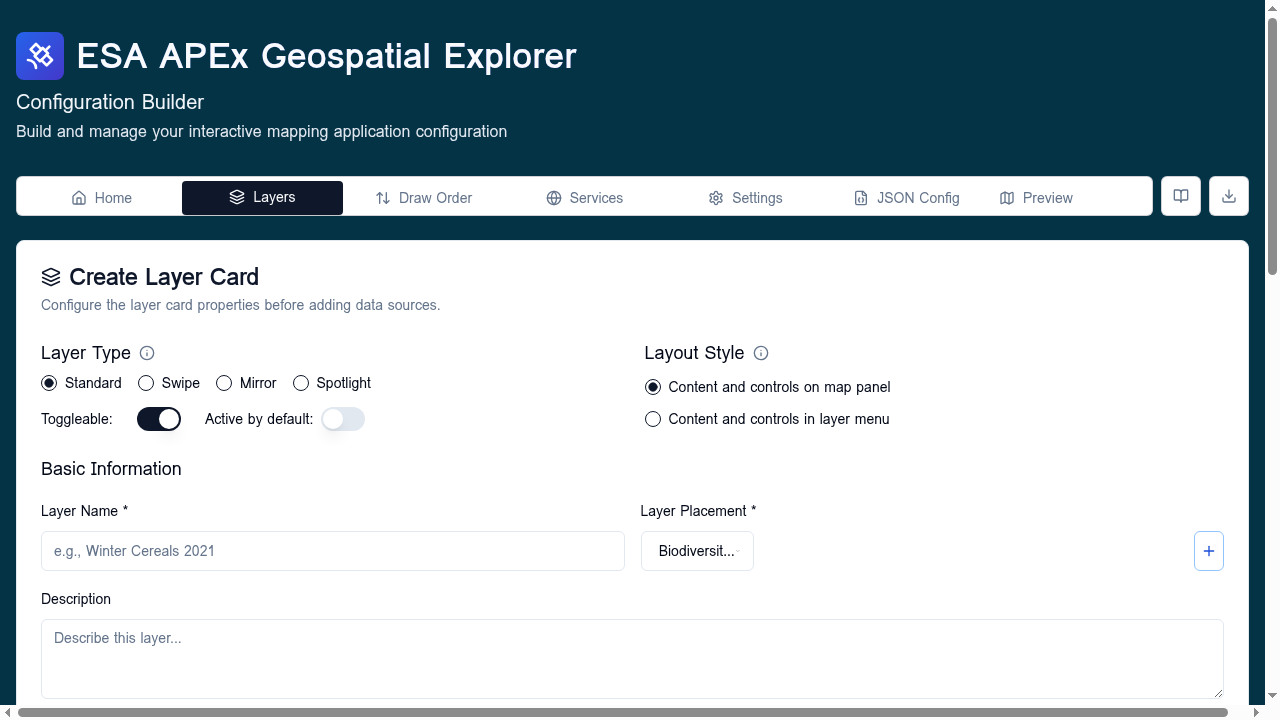
The layer editor opens. Work through the sections top to bottom.
Basic info
- Title — the label shown in the layer panel.
- Description — markdown is supported and rendered in the deployed Explorer's info panel.
- Interface group and optional Sub-interface group. Sub-groups are free text — type the same value on multiple cards to group them.
- Layer type — leave on Standard (or pick Swipe to switch to the Swipe layer flow).
Data sources
Click Add Data Source to open the Data Source form. Add as many as the sub-type needs (see the table above).
Visualisation
Pick exactly one styling tool — they are mutually exclusive:
- Colormap — for single-band rasters.
- RGB composite — multi-band raster colour mixing.
- Vector styling — rule-based fills, strokes, point symbols.
- Categories — discrete-value colour classification.
See Data visualisation for the trade-offs.
Legend, attribution, fields, controls
Lower sections cover legend image, attribution string, vector field labels, and UI controls (opacity slider, swipe handle, etc.). All optional but populating them clears Config QA flags on the Home tab.
Save
Click Save Layer to add the card. The Layers tab updates immediately and the new card scrolls into view.
Step 3 — The Data Source form
The form has two paths.
Direct connection. Provide a URL and pick the format. Use this when the data is a single standalone file — a one-off COG, GeoJSON, FlatGeoBuf, CSV, or XYZ template.
From an existing service. Pick one of the services declared on the Services tab. The form then offers:
- For WMS/WMTS/WFS — a layer/feature picker populated from
GetCapabilities. - For STAC — the STAC browser.
- For S3 — the S3 browser.
After you pick the layer, the form pre-fills the URL and any time-series or band metadata it can detect.
Statistics source. For COG-backed raster layers you can optionally add a Statistics source: a FlatGeoBuf or GeoJSON of zonal-statistics features. Click Add Statistics Source instead of Add Data Source to start the form in statistics mode.
Import Layer Card (beta)
When you launch Add New Layer from inside an existing interface group, the second tile becomes Import Layer Card instead of Base Layer. This lets you copy one or more standard layer cards from another configuration into the current group.
- Pick a donor configuration (file upload, URL, GitHub repo, or example).
- The donor's layer cards are listed grouped by their original interface group. Tick the cards you want.
- Click Import — the chosen cards are appended to the current group, bringing their data sources, styling, and metadata with them.
Imported services are added to the current config's service list if they are not already present. Duplicates are deduped by URL.
After saving
- Run the healthcheck to confirm the new layer reaches its data source.
- Open GE Preview to see the layer rendered in the actual APEx Geospatial Explorer.
- If the layer fails to render, double-check the data source URL, that it appears in the right interface group, and that the chosen visualisation matches the data type.
Related
- Layers — overview of the three layer types.
- Swipe layers — for side-by-side raster comparison.
- Base layers — for basemaps.
- Data visualisation — colormaps, RGB composite, vector rules, categories.