Service diagnostics
Every service on the Services tab is probed independently so you can tell, at a glance, which endpoints are healthy and which are failing — without having to run a full layer Healthcheck.
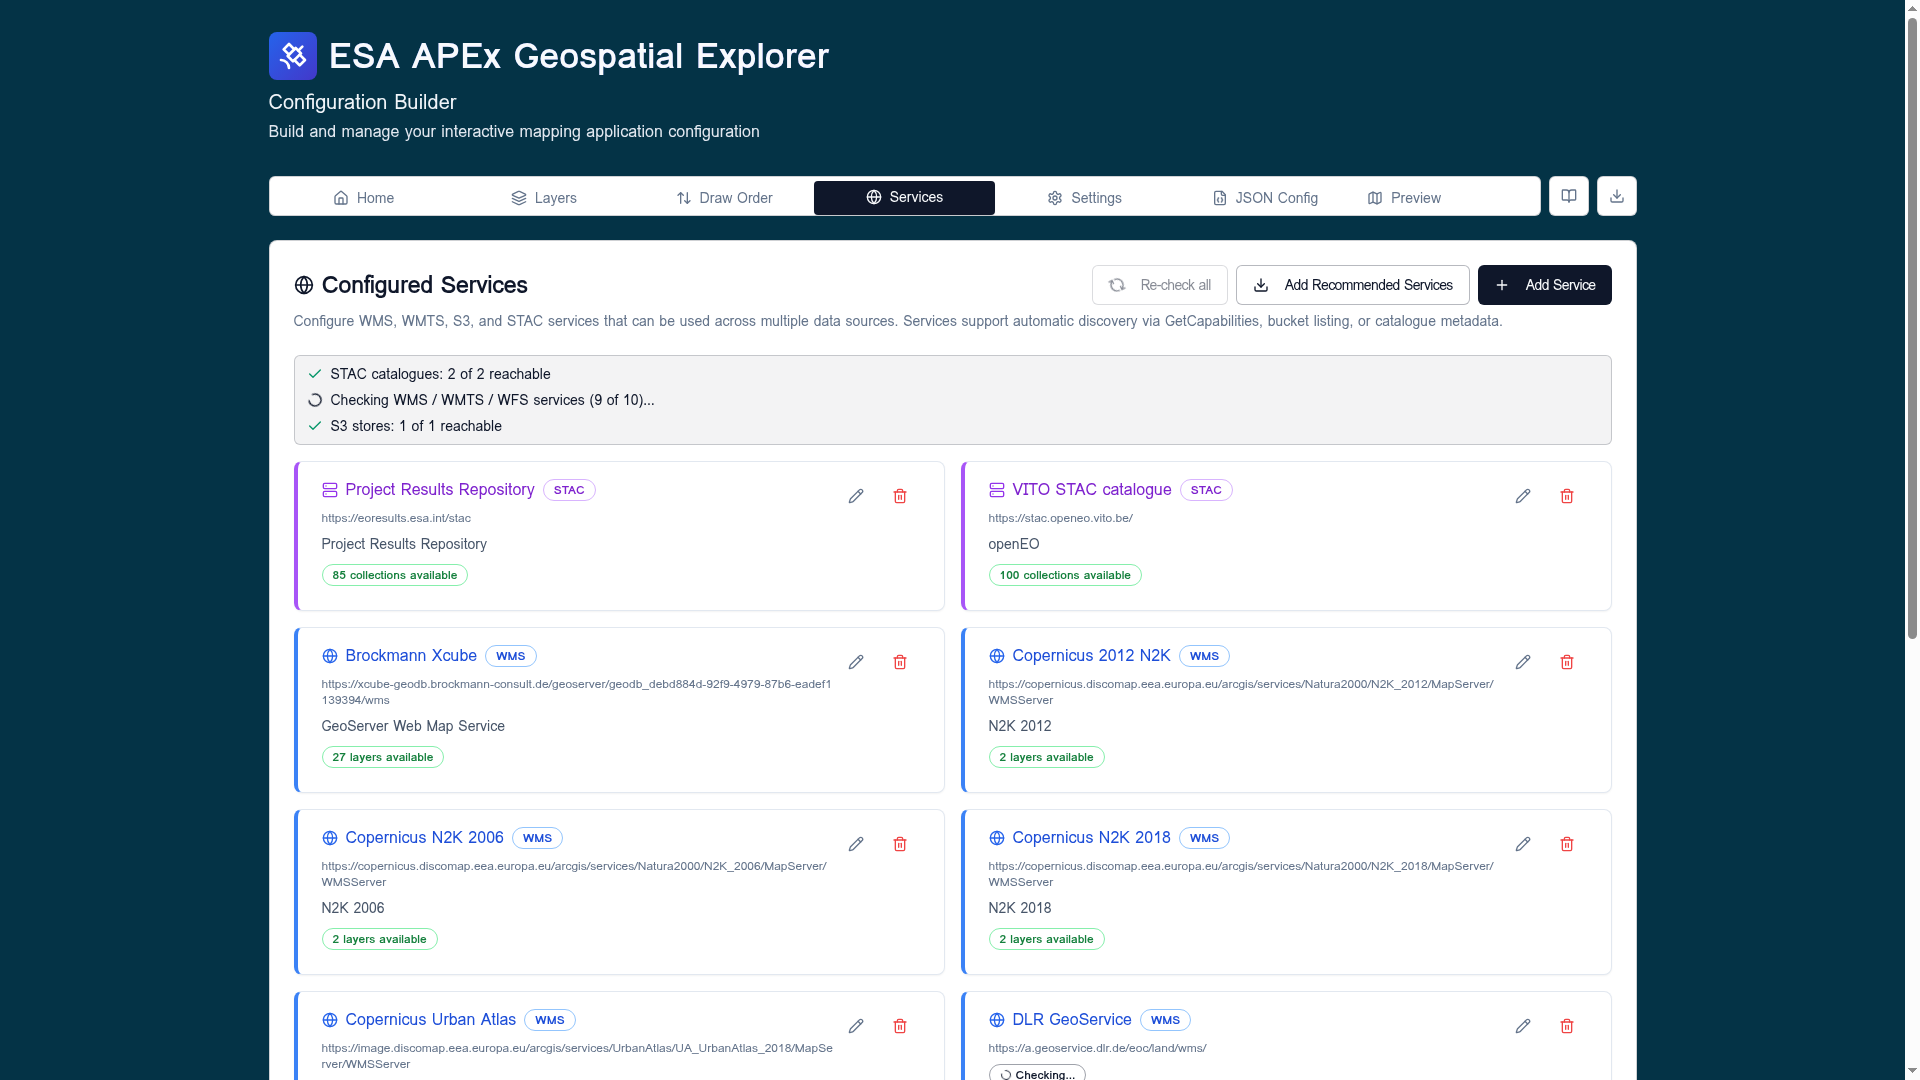
The validation summary
The banner at the top of the Configured Services card aggregates results across the whole config:
- STAC catalogues —
N of M reachable. - WMS / WMTS / WFS services — counts as each
GetCapabilitiescall resolves; a spinner is shown while the batch is still running. - S3 stores —
N of M reachable.
A row turns red when a service fails any probe so you can spot it without scanning the whole list.
Per-service probes
Each service card runs a focused set of checks for its type:
| Service type | Probes |
|---|---|
| WMS / WMTS / WFS | URL well-formed, mixed-content check, network reachability, GetCapabilities parses, layer count populated. |
| STAC | URL well-formed, root document fetch, collection enumeration, total item count. |
| S3 | URL well-formed, bucket listing, format detection on listed objects. |
A successful probe attaches a green badge — for example
27 layers available, 85 collections available, or Bucket reachable.
A failed probe marks the row in red and surfaces a short reason such as
Mixed content, Timeout, HTTP 404, Network error, or
Invalid URL.
Failure categories
The classifier (see src/utils/serviceDiagnostics.ts) maps low-level
errors into a short list of human-readable categories:
- invalid-url — the URL string itself is malformed.
- mixed-content — an
http://endpoint called from anhttps://builder; the browser blocks the request before it reaches the network. - network — DNS failure, offline, CORS, or transport reset.
- timeout — the request was aborted before the server responded.
- http-error — the server replied with
4xxor5xx. - parse-error — the response body was not the expected capabilities / catalogue document.
The same categories drive the more detailed per-layer breakdown in the Run Healthcheck dialog.
Re-running probes
Click Re-check all in the card header to clear cached results and re-run every probe — useful after editing a URL or after an external endpoint has come back online. Probes for an individual service also re-run when you edit and save its URL.
Tip
A service that is reachable but slow still validates green here. Performance grading happens at the layer level — see Run Healthcheck for the latency thresholds.